Discriminative Item Analysis
This item analysis option is only generated if the Item Analysis area of the key sheet is marked with a 2. This option is useful for evaluating individual test items in greater detail than is possible with the descriptive item analysis. Instructors who need an overview of the use of these statistics may contact Testing. The discriminative item analysis consists of two categories of information for each item:
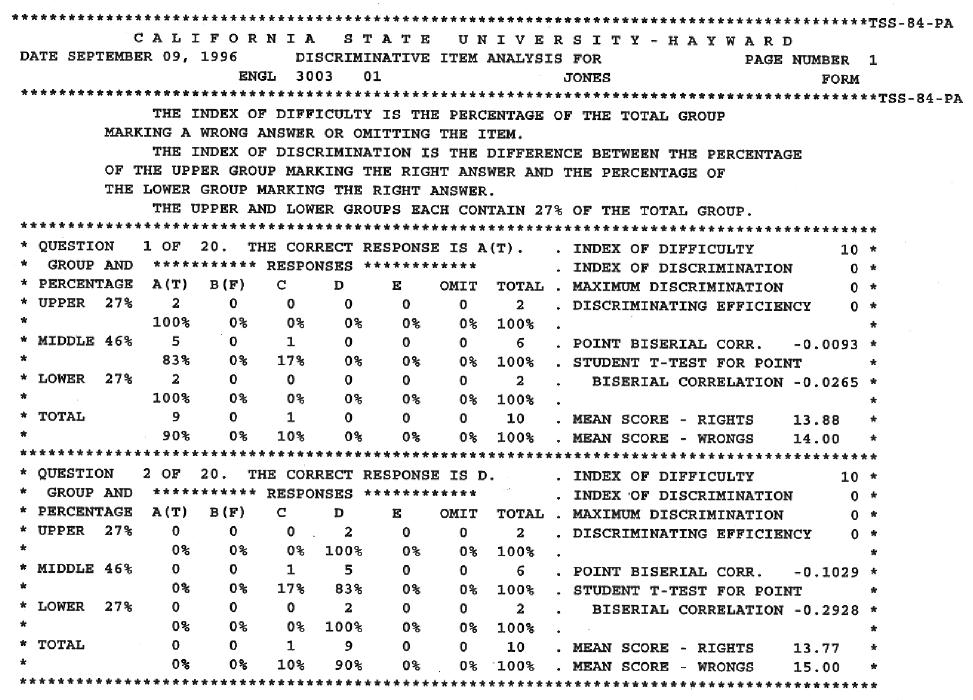
- High/Middle/Low Group Comparison: Students are separated into the following three groups:
- High: top 27% of the score distribution
- Middle: middle 46% of the score distribution
- Low: bottom 27% of the score distribution
- Item Statistics/Indices
- Index of Difficulty: This is the percentage of the total group which has responded incorrectly to the item (including omissions).
- Index of Discrimination:This is the difference between the percent of correct responses in the upper group and the percent of correct responses in the lower group.
- Maximum Discrimination: This is the sum of the percent in the upper and lower groups marking the item correctly. (If this sum is greater than 100, it is subtracted from 200.) This index indicated the maximum Index of Discrimination possible for the item, given the obtained response distribution. This maximum would be attained if the entire percentage of correct responses came from the upper group, with none coming from the lower group.
- Discriminating Efficiency: This is a ratio, calculated by dividing the Index of Discrimination by the Maximum Discrimination. The ratio thus obtained indicates how well the item actually did discriminate, as compared to how well it possibly could have discriminated.
- Point Biserial Correlation: This is a correlation between examinees' performance on the item (right or wrong) and total test score. The value calculated by the Student T-test for Point Biserial Correlation can be used to determine if the Point Biserial Correlation obtained is statistically significant. To make this determination, compare the value given by the t-statistic with the value given for N-2 degrees of freedom in a table of t-distribution values, where N=the number of examinees. Right/Wrong
- Group Means: Examinees are categorized into those correctly answering the item and those incorrectly answering the item. The mean total score for these two groups is given.